Run ELASPIC
On the main input page, users will see the page as below. Follow the numbers to correctly submit a job:
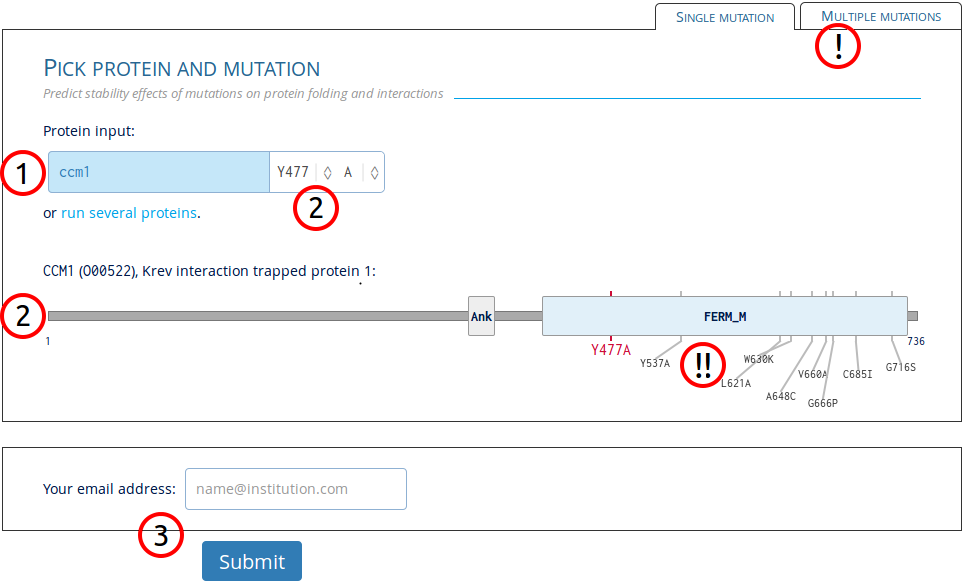
1. Enter protein identifier
Any protein in the Uniprot knowledgebase (>50M) can be entered with the most common identifiers, gene names, and synonyms (>800M). Example input: OO0522,
CCM1,
KRIT1_HUMAN,
ENSP00000391675,
GC07M091828.
- Warning: as only structural models for the human proteome has been precalculated, predictions for other organisms can be expected to last multiple hours per mutation.
2. Select mutation in protein
Mutations can be selected by either clicking the protein figure or by using the select option next to the protein input.
- Warning: because ELASPIC uses structures of protein domains to predict stability/affinity effects, the mutation has to fall within known domain boundries.
3. Submit job
A valid e-mail address can be entered for notifications about the submitted job. An email will be sent on job start and completion with a link to the results. Check junk e-mail folder in case the notification got delivered there.
! Switch to batch input
Alternative option to input multiple mutations at once or upload a file with data.
!! See previously run mutations
Mutations already in the database are shown on the protein figure. Click each individual mutation to see their results in the same format as on the result page.
ELASPIC prediction results
As output, ELASPIC gives a table of selected mutations and their predicted stability effects, as seen below:
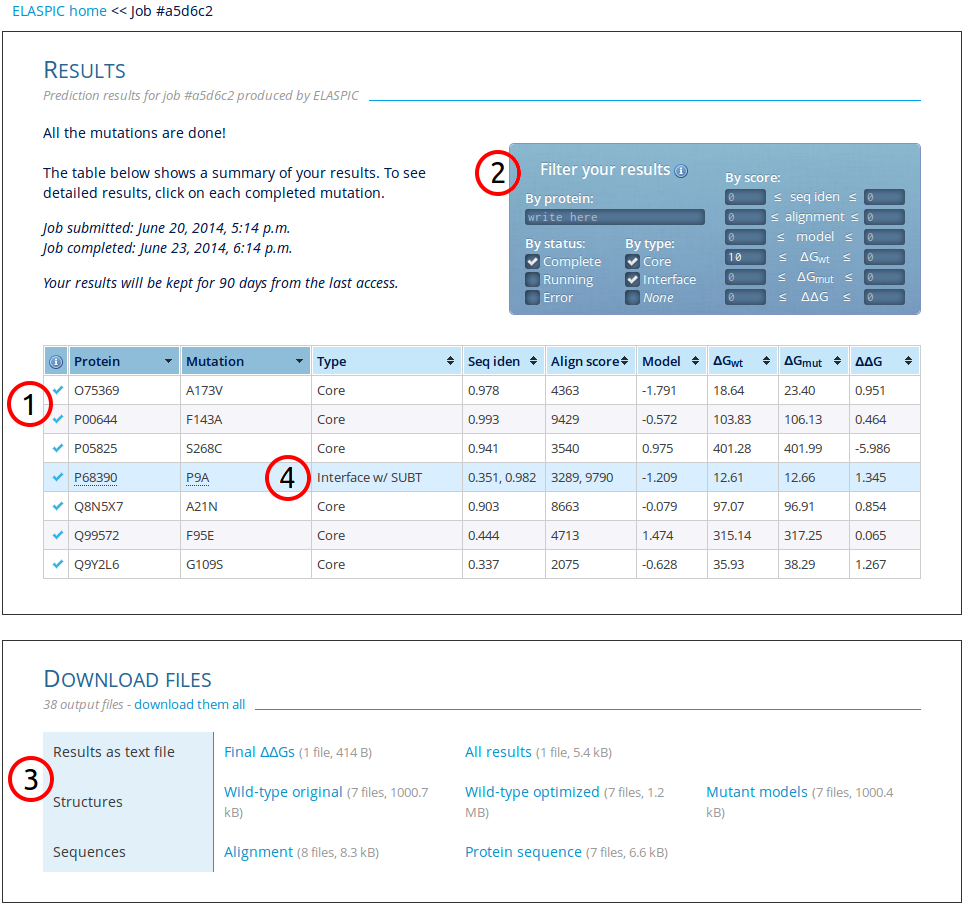
1. Result table
ELASPIC distinguishes between two types of mutations:
core (of domain) and
interface (between two proteins known to interact). Besides mutation type, the table has six colums with results:
(i-ii) The sequence identity and alignment score of the template used to model the protein domain or interaction structure.
(iii) The DOPE score of the model given by Modeller.
(iv-v) The Gibbs free energy of the optimized wild-type and mutated models calculated by
FoldX.
(vi) The final change in domain stability (core) or binding affinity (interface) as predicted by ELASPIC.
- Notice: For interface mutations two values are given for both sequence identity and alignment score. The first one given will always be for the protein entered while the second is for the interacting protein. Furthermore, in the interface multiple
interactions might be affected, and multiple rows will then be shown in the result table for the same mutation.
2. Filter results
The result table can be filtered to only show the specific rows desired. Filtering can be done by protein name, status of calculations, type of mutation, and by result scores.
- Notice: Filtering not only filters the table, but also the downloadable files.
3. Downloadable files
The results can be downloaded in a tab-delimited text file with either only the final predicted energy change or with every single feature used by ELASPIC. Furthermore, created models, alignments, and sequences can be downloaded.
4. See detailed results for mutation
Each completed row can be clicked to see detailed results.
Detailed results
The detailed results include a protein domain graphic and the modelled and wild-type protein structures superimposed in an enhanced dynamic 3D structure viewer:
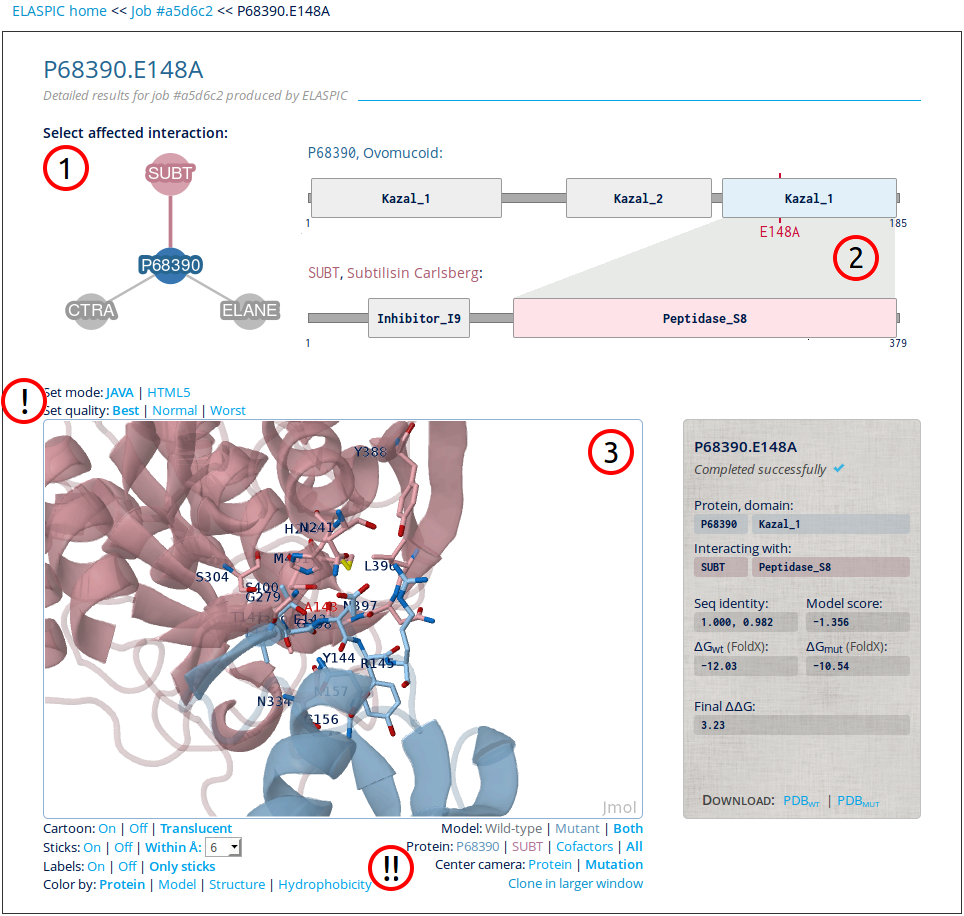
1. Affected interaction network
All interactions affected by the mutation are included in the network. Each interaction can be clicked to display its detailed results.
- Notice: For core mutations the interaction network is not shown.
2. Protein interaction figure
The selected interaction is shown as a figure with all protein domains. The interacting domains are color-coded with blue for entered protein and pink for interacting protein.
- Notice: For core mutations only the entered protein is shown.
3. Modelled structure
A Jmol plugin shows both the modelled wild-type and mutant structures. See mouse controls in their wiki.
! Set quality settings
Jmol runs by default in in Java mode. However, if Java not is installed or compatible with the browser (e.g. mobile phones) the plugin can be switched to HTML5 mode with a single click. Furthermore, if the structural rendering is too demanding for the
browser, the quality can be reduced.
!! Set display settings
The buttons below the plugin can manipulate the display. To control details such as labels, colors, and schemes use the buttons on the left. To view or hide a model or protein, or to view the structures in a larger window use the buttons on the right.


